
You can use Google Chrome to remotely view the console log of Translator++. This will allow us to view the logs even when the Translator++ is closing on it’s own (i/e crashes)
follow the following steps :
1. Open Command Prompt
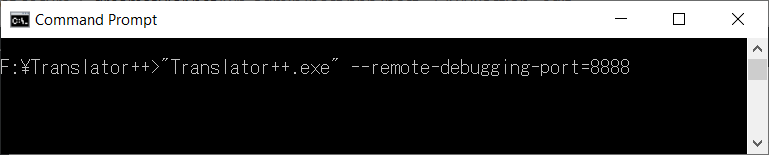
2. Run Translator++ from command prompt with the following command:
"Translator++.exe" --remote-debugging-port=8888
3. Open your Google Chrome, and enter this address :
chrome://inspect/#devices
A remote debugging options will open.
4. Click Configure button, add the following line into the “Target discovery settings” :
localhost:8888
and then click “Done”
5. After several seconds, two options will apper in the Remote Target.
Click inspect to the translator++ chrome-extension://…./www/trans.html
A remote debugging window will open. Now, this remote debugging will stay open even when Translator++ closes.